—— Material Selection, Fatigue Mechanics and Scalable Manufacturing Strategy for Industrial-Grade Additive Manufacturing Bicycle Saddles
💡 3D printed bicycle saddles are transitioning from niche premium products into scalable OEM manufacturing solutions, but their commercial feasibility depends on controlling polymer fatigue, lattice design efficiency, post-processing yield, and production economics. Under a production assumption of 50,000 units/year, industrial TPU additive manufacturing can achieve a projected FOB cost range of $42–58/unit compared with $18–35 for conventional foam saddles, while enabling a retail premium of $120–250 through improved pressure distribution and customization capability. The engineering bottleneck is not printing speed alone, but achieving ISO 4210 fatigue durability under repeated 1,500–2,200 N dynamic loads. A modular lattice platform combined with digital customization and hybrid rail structures provides the highest probability path toward profitable OEM adoption.
Key Decision Metrics
A 3D printed bicycle saddle project reaches economic feasibility when annual production exceeds approximately 30,000–50,000 units because fixed engineering investment of $80,000–150,000 can be diluted below $3/unit. Structural validation should target a minimum fatigue life exceeding 200,000–500,000 load cycles under ISO 4210 saddle testing conditions, with local stress concentration factors maintained below $K_t=2.0\sim2.5$ in rail-transition regions. A commercial ROI threshold occurs when the production cost premium of $20–30/unit can support an additional retail value of at least $80–150/unit through improved pressure distribution, customization capability, and brand differentiation. The recommended entry strategy is a 10,000-unit pilot followed by 50,000-unit industrial scaling.
1. OEM Cost Structure Determines Commercial Threshold
The global bicycle saddle supply chain remains dominated by injection-molded polymer shells, PU/EVA foam padding, and steel or alloy rails because these technologies have decades of manufacturing optimization. Traditional saddle OEM production benefits from high-volume tooling amortization, where injection molds typically require $8,000–25,000 investment but can support hundreds of thousands of units.
A 3D printed saddle changes the manufacturing equation by transferring value from physical tooling into digital engineering capability. The primary capital expenditure shifts from molds toward additive manufacturing equipment, lattice simulation, material validation, and customization software.
The commercial question is therefore not whether additive manufacturing can produce a bicycle saddle, but whether the additional engineering cost can generate sufficient product margin.
The following model assumes an OEM manufacturer located in China, FOB Shenzhen port, USD/CNY exchange rate of 7.2, industrial TPU material pricing based on 2026 commercial supply conditions, and production targeting premium road, gravel, and e-bike saddle segments.
| Cost Component | 2,000 units/year | 10,000 units/year | 50,000 units/year | 100,000 units/year |
|---|---|---|---|---|
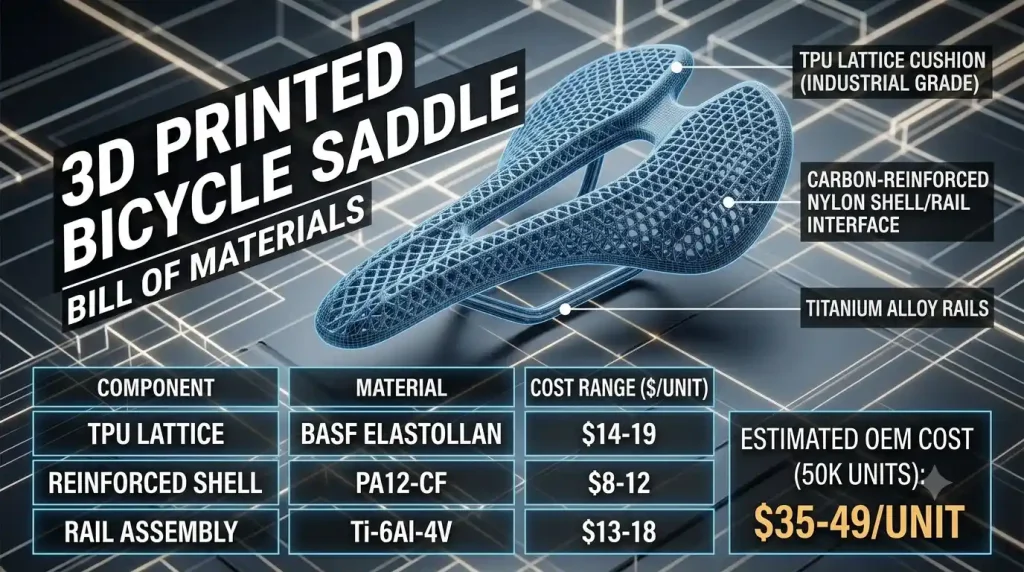
| Industrial TPU lattice material ($32/kg basis) | $18.5/unit | $16.8/unit | $14.2/unit | $13.5/unit |
| Carbon reinforced nylon shell/rail interface | $12.0/unit | $10.5/unit | $8.5/unit | $7.8/unit |
| Carbon or titanium rail assembly | $18.0/unit | $16.5/unit | $14.0/unit | $12.5/unit |
| Printing machine depreciation | $15.0/unit | $8.0/unit | $3.2/unit | $1.8/unit |
| Labor and post-processing | $14.0/unit | $10.5/unit | $7.5/unit | $6.8/unit |
| Quality inspection and fatigue testing allocation | $8.0/unit | $4.5/unit | $2.0/unit | $1.5/unit |
| Packaging and FOB logistics | $3.5/unit | $3.5/unit | $3.5/unit | $3.5/unit |
| Mold/tooling amortization ($12,000 initial tooling) | $6.0/unit | $1.2/unit | $0.24/unit | $0.12/unit |
| Estimated FOB Cost | $95.0/unit | $71.5/unit | $53.1/unit | $47.5/unit |
Table Interpretation:
The critical cost transition occurs between 2,000 and 50,000 units/year. Equipment depreciation, engineering validation, and development costs decrease rapidly as volume increases. At 50,000 units/year, the cost gap compared with premium conventional foam saddles narrows to approximately $20/unit, allowing customization value to compensate for manufacturing premium.
[Visual/Diagram Recommendation: Insert an OEM/ODM product BOM cost breakdown chart and tooling amortization curve. Highlight the sharp reduction in unit engineering cost from 2,000 units to 50,000 units annually.]
Traditional injection-molded saddles maintain cost advantages through scale, but 3D printing creates economic value through product variation. When a bicycle brand needs ten saddle models optimized for different riding positions, body weights, or sit-bone widths, conventional manufacturing requires multiple molds. Each mold may require $8,000–20,000 capital investment.
A digital manufacturing workflow only requires modification of the CAD lattice structure. Product iteration time can therefore decrease from 8–16 weeks of mold development to approximately 2–4 weeks of digital engineering validation.
The commercial implication is that additive manufacturing becomes economically attractive when product lifecycle speed, customization capability, and premium positioning outweigh the lowest possible manufacturing cost.
2. Material Mechanics Define Fatigue Lifetime
A 3D printed bicycle saddle is fundamentally a cyclic-load structural component. During real riding conditions, the saddle experiences rider weight, pedaling vibration, road impact, and repeated deformation.
Assuming a 90 kg rider and approximately 40% body weight transferred through the saddle:
The static saddle load becomes:
During aggressive gravel riding, dynamic amplification can reach:
where $k$ represents the dynamic load amplification factor.
However, certification testing applies significantly higher forces. Industrial validation should consider ISO 4210 saddle fatigue conditions exceeding 1,500–2,200 N depending on test configuration.
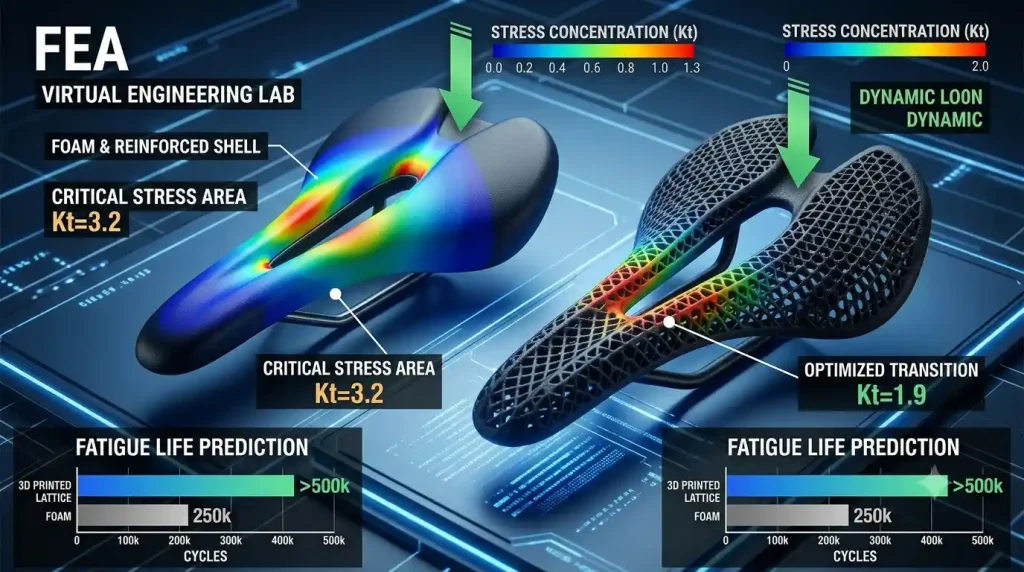
The primary structural challenge is stress concentration around lattice nodes and rail interfaces.
The stress concentration factor is defined as:
where
epresents local peak stress and
represents average structural stress.
Poor lattice transitions may generate:
which accelerates crack initiation despite acceptable average stress levels.
Industrial designs typically target:
through optimized transition radius, variable lattice density, and finite element analysis.
| Material System | Typical Grade | Density (g/cm³) | Tensile Strength (MPa) | Elastic Modulus (GPa) | Fatigue Characteristics | Test Reference |
|---|---|---|---|---|---|---|
| TPU Elastomer | BASF Elastollan / Industrial TPU | 1.10–1.25 | 30–55 | 0.05–0.15 | High energy absorption but temperature sensitive | ASTM D638 |
| Carbon Fiber Nylon | PA12-CF / PA6-CF | 1.10–1.35 | 80–160 | 5–10 | High stiffness, moisture sensitivity requires control | ASTM D638 |
| Titanium Alloy Rail | Ti-6Al-4V | 4.43 | 900–1,100 | 110 | Excellent fatigue resistance, high material cost | ASTM E466 |
Table Interpretation:
The material system should not be evaluated as a single component. TPU provides vibration absorption and comfort tuning, carbon fiber reinforced polymers provide structural stiffness, and titanium rails provide long-cycle fatigue resistance.
[Visual/Diagram Recommendation: Insert FEA stress distribution analysis showing maximum $K_t$ regions around saddle rail connections, lattice node stress concentration, and predicted fatigue crack initiation paths.]
Fatigue behavior can be described using the Basquin relationship:
where $\sigma_a$ represents cyclic stress amplitude, $N_f$ represents fatigue life, and $\sigma’_f$ and $b$ are experimentally determined material parameters.
For TPU materials, fatigue failure differs from metallic crack propagation. Failure mechanisms include polymer chain breakage, permanent compression deformation, and heat accumulation caused by hysteresis loss.
Industrial-grade TPU requires strict control of moisture content, drying temperature, printing parameters, and post-processing conditions. Under 40°C temperature and 80% relative humidity, certain desktop-grade TPU materials may experience significant mechanical degradation.
The commercial implication is that OEM buyers should evaluate supplier fatigue databases and validation capability rather than printing capability alone.
3. Biomechanics Determines Premium Value
Traditional bicycle saddle comfort relies mainly on foam thickness and hardness adjustment. A 3D printed structure enables regional stiffness control through lattice density, geometry, and elastic response.
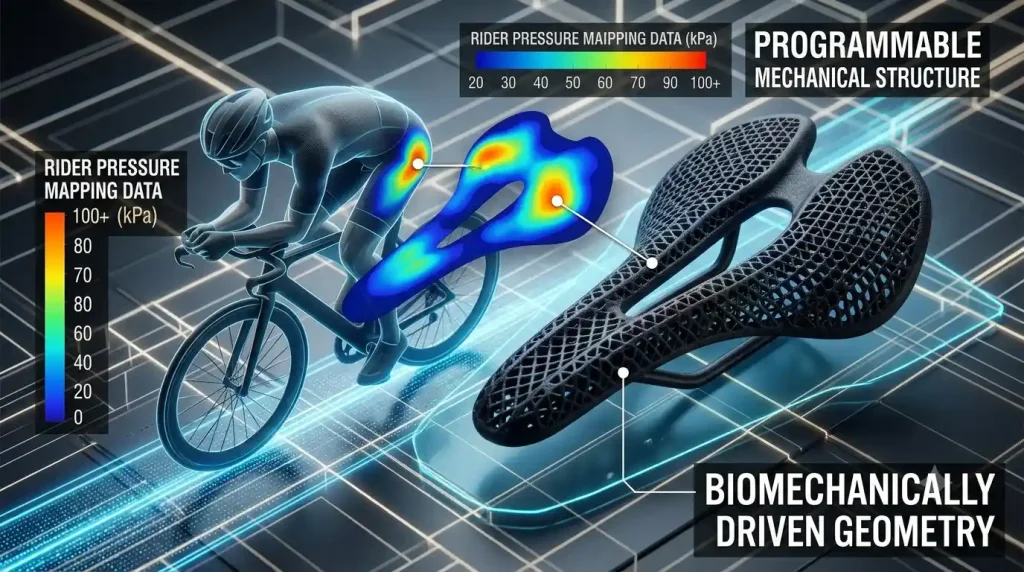
The human body-seat interface is governed by pressure distribution rather than softness alone. Long-duration cycling generally requires average contact pressure within approximately 20–60 kPa, while local peaks exceeding 100 kPa increase discomfort risk.
Pressure distribution performance can be evaluated using:
where $P_{max}$ represents peak pressure and $P_{avg}$ represents average pressure.
Traditional foam saddles may produce:
while optimized lattice structures can reduce this ratio toward:
The engineering advantage comes from converting human pressure mapping data directly into structural parameters. Sit-bone regions require higher stiffness to maintain support, while central regions require lower stiffness to reduce soft tissue pressure.
📌 “The competitive advantage of a 3D printed saddle is not replacing foam; it is transforming human pressure data into a programmable mechanical structure.”
The commercial implication is that brands can move from selling a standard bicycle component toward offering a high-value ergonomic product based on rider-specific requirements.
4. System Solution Creates Scalable OEM Path
Industrial commercialization requires avoiding fully customized production at the beginning because every individual variation increases validation complexity.
The most practical approach is a modular digital platform.
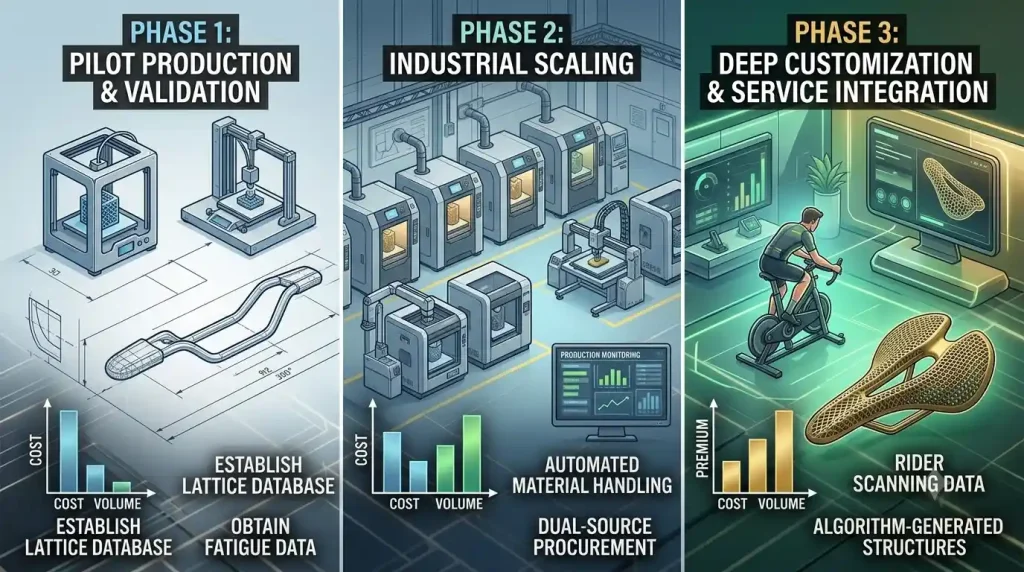
Phase 1 requires approximately $80,000–150,000 investment to establish lattice databases, material validation procedures, and a 10,000-unit pilot production capability. The primary objective is not minimum cost but obtaining reliable fatigue data and customer qualification.
Phase 2 requires approximately $200,000–500,000 investment for industrial printing expansion, automated material handling, production monitoring, and dual-source material procurement. Supply chain strategy should maintain at least two qualified TPU suppliers and two reinforced polymer suppliers.
Phase 3 introduces deep customization using rider scanning data, cycling position analysis, and algorithm-generated lattice structures. The business model evolves from manufacturing supply toward engineering service integration.
| System Upgrade | Conventional Saddle | 3D Printed Saddle System | Cost Change | Performance Change | ROI Assumption |
|---|---|---|---|---|---|
| Cushion structure | EVA/PU foam | Variable density TPU lattice | +$18/unit | 20–40% pressure peak reduction | Retail premium +$100 |
| Development method | New mold required | Digital model update | $10k–20k tooling saving/model | 50–75% shorter development cycle | Payback within 18–30 months |
| Customization | Limited sizing | Rider-specific lattice | +$20–40/unit | Improved pressure adaptation | Higher premium segment margin |
Table Interpretation:
The correct comparison is not only manufacturing cost per unit. The strategic value comes from reducing tooling dependency, accelerating product development, and enabling premium segmentation.
ROI can be calculated as:
Assuming 50,000 units/year and additional gross profit of $50/unit:
An initial engineering investment of $500,000 could therefore achieve theoretical payback within one year under successful market adoption.
5. Strategic Barrier Comes From Engineering Data
3D printed bicycle saddles will not replace all conventional saddles because mass-market products still depend on injection molding economics. However, premium road cycling, gravel cycling, e-bike performance segments, and OEM customization projects provide a favorable commercial environment.
The real competitive barrier is not ownership of printing equipment. The barrier comes from accumulated fatigue databases, pressure mapping models, lattice optimization algorithms, and long-term reliability validation.
When a company reaches 50,000–100,000 units annual production and accumulates millions of fatigue test cycles, competitors cannot easily replicate the engineering foundation.
The next stage of competition will shift from “who can print a saddle” toward “who owns the largest human-material-structure performance database.”
For bicycle brands and OEM manufacturers, a 3D printed saddle project should be considered a structural engineering platform investment rather than a single product development project.