OEM and ODM bicycle saddles plus global bicycle components sourcing
OEM and ODM bicycle saddles plus global bicycle components sourcing
How Much Does It Cost to Have a Custom Bicycle Saddle Made?
How a $184,000 Engineering Investment Reduced Lifetime Saddle Cost by $18.40 Per Unit
—— Industrial Cost Breakdown, Structural Redesign Strategy and OEM Manufacturing ROI Analysis
💡 Executive Summary
Custom bicycle saddle development is often evaluated incorrectly. Many purchasing teams compare only factory quotations, focusing on the initial unit price difference between a standard saddle and a customized platform. However, the true cost of a saddle program includes tooling amortization, production yield, assembly efficiency, warranty exposure, replacement logistics, and supply-chain stability.
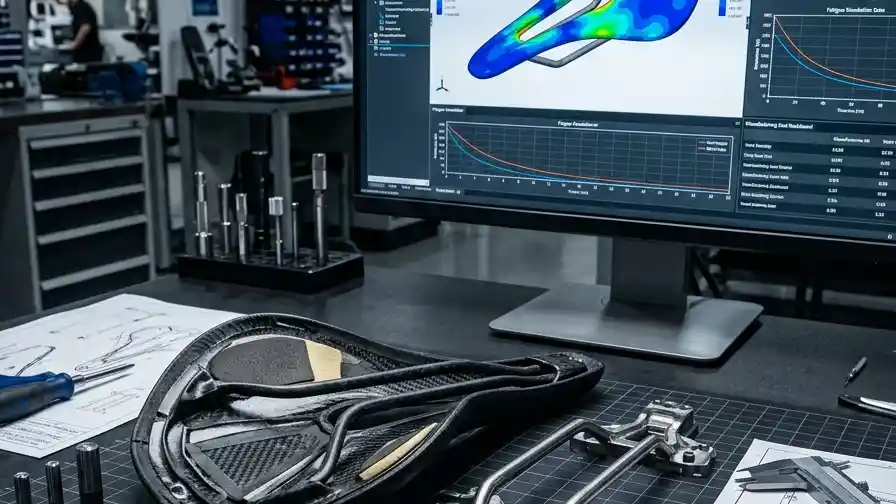
This industrial case examines a representative OEM custom saddle redesign program where a performance saddle platform required engineering optimization due to manufacturing variation, elevated stress concentration around rail interfaces, and excessive warranty risk. The redesign investment included structural simulation, carbon shell optimization, manufacturing fixture improvement, and production quality control upgrades.
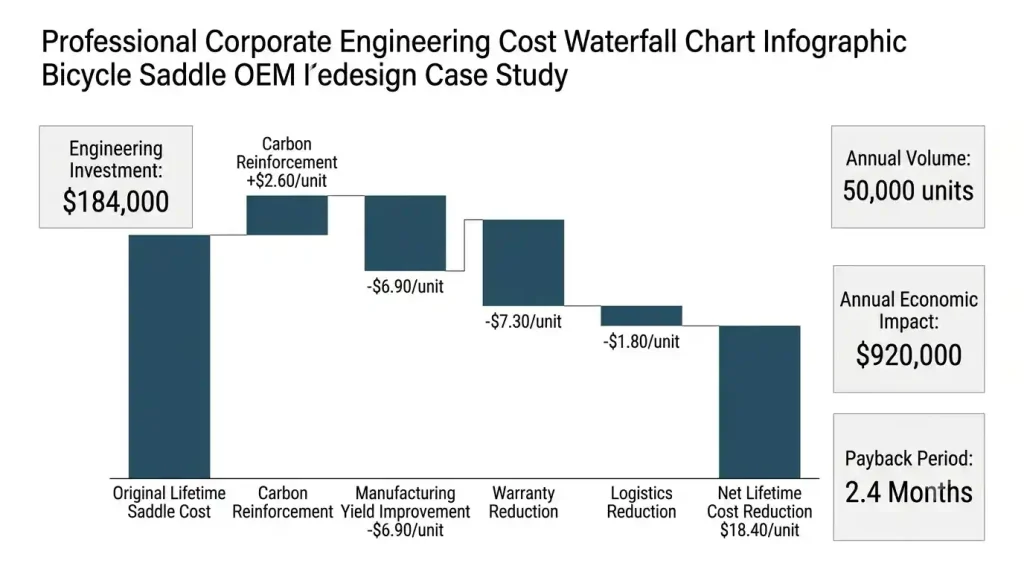
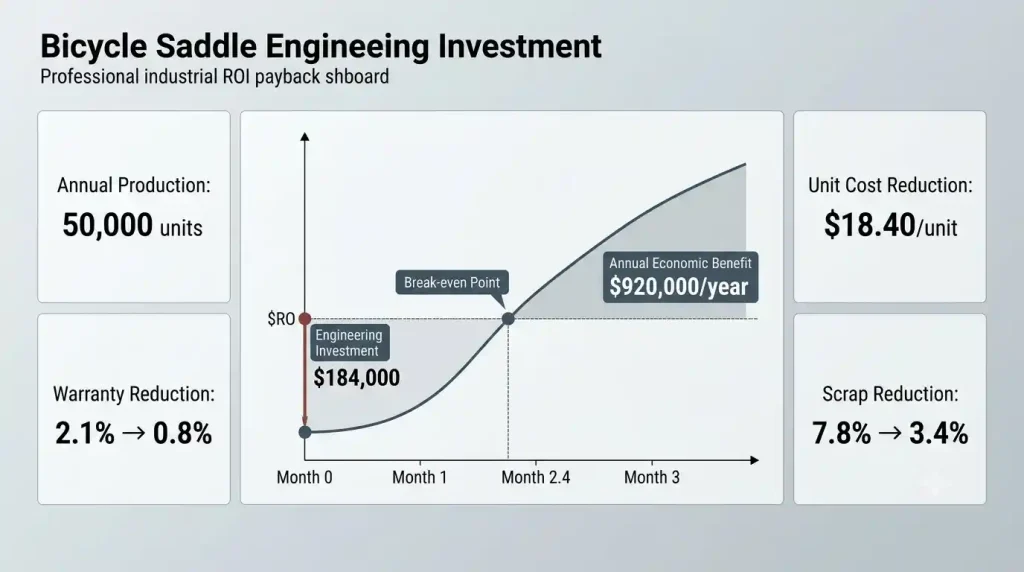
Under the stated engineering assumptions, the program required a one-time engineering investment of $184,000 and generated an estimated lifetime cost reduction of $18.40 per saddle at an annual production volume of 50,000 units.
The cost reduction was not achieved through cheaper materials. Instead, value was created through a combination of manufacturing yield improvement, reduced assembly labor, lower warranty exposure, and improved production consistency validated through engineering methods based on ISO 4210-9, ASTM E466, and fracture mechanics principles described in ASTM E399 and ASTM E1820.
Annual economic impact: approximately $920,000/year
Simple payback period: approximately 2.4 months under stated assumptions
Executive ROI Snapshot: Custom Saddle Redesign Business Case
A custom saddle program should be evaluated as an engineering investment rather than a simple manufacturing purchase.
Item
Before Redesign
After Redesign
Financial Impact
Annual Production Volume
50,000 units
50,000 units
Baseline
Engineering Investment
—
$184,000
One-time CapEx
Tooling Investment
$95,000
$95,000
No change
Manufacturing Scrap Rate
7.8%
3.4%
-4.4 percentage points
Assembly Labor Time
6.2 min/unit
4.7 min/unit
-1.5 min/unit
Warranty Return Rate
2.1%
0.8%
-1.3 percentage points
Material Cost Change
—
+$2.60/unit
Structural reinforcement
Manufacturing Yield Saving
—
-$6.90/unit
Process improvement
Warranty Cost Saving
—
-$7.30/unit
Lower failure exposure
Logistics Saving
—
-$1.80/unit
Reduced replacement handling
Total Lifetime Cost Reduction
—
$18.40/unit
Business impact
The engineering investment calculation:
Annual Economic Benefit
= $18.40 × 50,000 units
= $920,000/year
Simple Payback Period
= $184,000 ÷ $920,000
= 0.20 years
≈ 2.4 months
These values represent an engineering estimate under the stated production assumptions and should be adjusted according to actual supplier quotations, warranty history, and production volume.
1. Industry Context, Operating Conditions & Critical Industrial Pain Points
1.1 Operating Environment & Baseline Mechanical System
A bicycle saddle is a lightweight structural component exposed to repeated loading, vibration, environmental exposure, and fatigue accumulation.
Unlike static consumer products, saddles experience millions of loading events during their service life.
The structural system normally contains four major elements:
Component
Typical Materials
Engineering Function
Rail
Chromoly steel, titanium alloy, carbon composite
Transfers rider load to seat post
Shell
Nylon composite, carbon fiber reinforced polymer
Maintains structural platform
Padding
EVA foam, polyurethane foam
Controls pressure distribution
Cover
Synthetic leather, microfiber
Provides durability and appearance
A custom saddle development program typically requires:
Industrial design adaptation
CAD engineering
Mold development
Prototype production
Mechanical testing
Production validation
Supplier qualification
The manufacturing cost structure is therefore influenced by both direct material cost and indirect engineering efficiency.
A low-cost saddle with poor process capability may generate higher total ownership cost than a more expensive saddle with controlled manufacturing.
1.2 Failure Diagnostics & Root Cause Micro-Mechanics
Fatigue failures usually begin at locations where stress exceeds local material capability.
Common failure initiation zones include:
Rail bending transitions
Shell attachment areas
Bonding interfaces
Carbon laminate discontinuities
The stress concentration factor is expressed as:
Kt = Maximum Local Stress / Nominal Applied Stress
A sharp geometric transition increases local stress concentration and accelerates fatigue damage.
Metal rail fatigue behavior can be evaluated through fracture mechanics methods.
According to ASTM E399, fracture toughness testing determines material resistance against crack propagation.
For crack growth analysis, the Paris-Erdogan relationship is commonly applied:
da/dN = C(ΔK)m
where:
da/dN = crack growth rate
ΔK = stress intensity factor range
C and m = material constants
For composite saddle shells, failure mechanisms include:
Matrix cracking
Fiber breakage
Delamination
Resin-rich regions
Manufacturing voids
Therefore, carbon saddle design cannot rely only on tensile strength. Fatigue performance depends on laminate architecture and manufacturing consistency.
The hidden cost of failure increases through the supply chain because every additional organization adds labor and operational overhead.
For a supplier producing 50,000 units annually, reducing warranty exposure by even one percentage point can represent substantial financial improvement.
2.1 Material Re-Engineering & Metallurgical Selection
Material selection requires balancing:
Strength
Fatigue resistance
Weight
Corrosion resistance
Manufacturing cost
For metallic components, microstructure strongly affects mechanical behavior.
The Hall-Petch relationship describes the relationship between grain size and yield strength:
σy = σ0 + kyd-1/2
where smaller grain size generally increases yield strength.
For saddle rails, engineering considerations include:
Heat treatment control
Surface finish
Residual stress management
Corrosion protection
For composite shells, the redesign focused on:
Fiber orientation optimization
Reduced unnecessary laminate thickness
Improved reinforcement placement
Better process repeatability
The objective was not simply adding carbon material, but placing reinforcement where the load path required it.
2.2 Geometric Re-Engineering & Finite Element Analysis
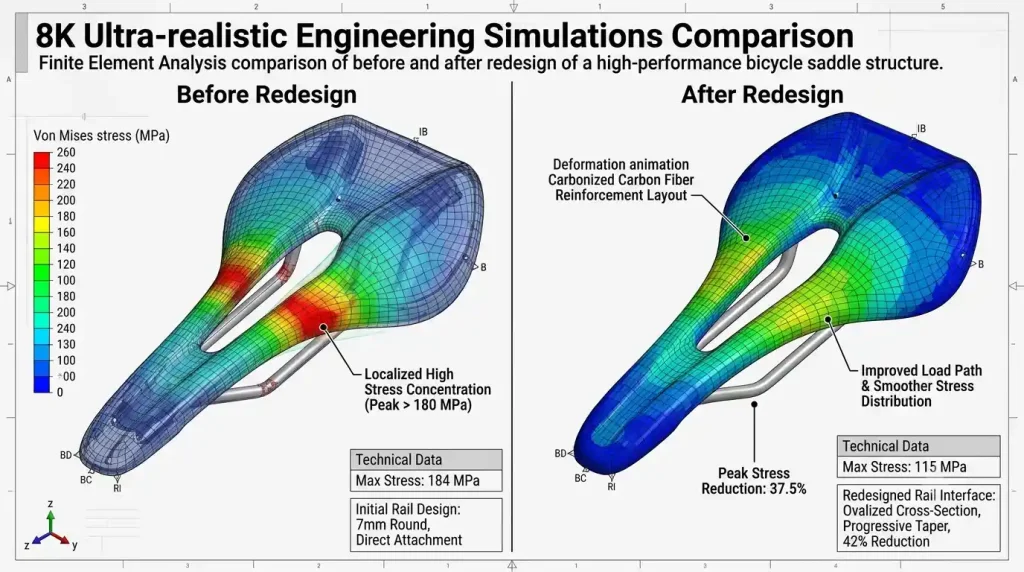
The original design showed excessive stress concentration around rail-shell transition zones.
The redesign included:
Increased transition radius
Improved load transfer geometry
Optimized shell thickness distribution
Revised carbon fiber orientation
The FEA process included:
CAD preparation
Material property assignment
Mesh generation
Boundary condition definition
Static loading simulation
Fatigue risk evaluation
Physical validation
The simulation results were correlated with mechanical testing according to principles used in ASTM E466 fatigue evaluation.
2.3 Manufacturing Process Optimization & Quality Control
The production improvement focused on reducing variation rather than simply reducing material cost.
Major changes included:
Manufacturing Area
Improvement
Carbon lay-up
Positioning fixtures introduced
Rail assembly
Improved alignment control
Inspection
Increased process traceability
Material control
Batch identification system
Production transfer
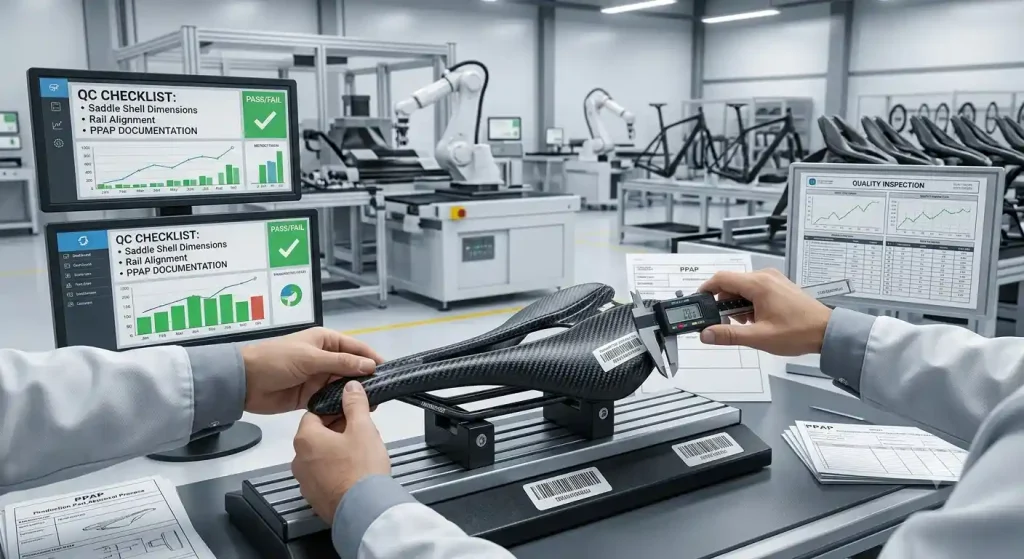
PPAP-style documentation
A key lesson from implementation was that engineering optimization alone does not guarantee commercial success.
During initial production transfer, the carbon laminate design achieved the expected mechanical performance, but production variation remained higher than acceptable because manual fiber placement created inconsistent reinforcement locations.
Corrective actions included:
Additional operator training
Updated positioning fixtures
Improved incoming material control
The lesson was simple: a theoretically optimized structure requires manufacturing discipline to become a reliable commercial product.
Table 1: Baseline vs Redesigned Parameter Comparison
Parameter
Baseline Design
Redesigned Design
Stress concentration
Higher local stress area
Reduced transition stress
Carbon laminate
General reinforcement
Load-oriented fiber placement
Scrap rate
7.8%
3.4%
Assembly time
6.2 min/unit
4.7 min/unit
Warranty return rate
2.1%
0.8%
Validation approach
Basic inspection
ISO 4210-9 + ASTM E466 based testing
The redesign improved both structural reliability and manufacturing economics by reducing failure drivers rather than increasing material quantity.
Table 2: BOM Cost Breakdown
Cost Element
Before
After
Difference
Carbon shell
$8.40
$11.00
+$2.60
Rail system
$5.80
$5.80
$0
Foam and cover
$3.20
$3.20
$0
Assembly labor
$4.10
$2.60
-$1.50
Scrap allowance
$2.30
$0.90
-$1.40
Quality inspection
$0.80
$0.60
-$0.20
Warranty reserve
$3.60
$1.30
-$2.30
The redesigned saddle increased material investment but reduced downstream manufacturing and warranty costs.
3. Multi-Dimensional Quantitative Validation
3.1 Performance & Reliability Validation
Reliability testing followed established bicycle safety requirements.
Fatigue damage accumulation can be estimated using Miner’s rule:
&Dsum; = Σni/Ni
The purpose is to understand cumulative damage under different loading conditions.
Environmental durability evaluation may include corrosion testing following:
ISO 9227 salt spray testing methodology.
3.2 Bottom-Line Financial Impact
The $18.40/unit improvement came from four sources:
Improvement Source
Contribution
Manufacturing yield improvement
$6.90/unit
Warranty reduction
$7.30/unit
Logistics reduction
$1.80/unit
Assembly efficiency
Included in manufacturing saving
Material increase
-$2.60/unit
Net economic improvement:
$18.40/unit
At 50,000 units:
$920,000 annual impact
3.3 Supply Chain Velocity Improvement
The redesign also improved operational stability.
Expected improvements:
Area
Impact
Supplier communication
Clearer specifications
Production planning
Lower uncertainty
Quality inspection
Reduced corrective actions
Inventory planning
Lower safety stock requirement
Table 3: Annual Volume Sensitivity Analysis
Annual Volume
Engineering Cost Allocation
Economic Impact
2,000 units
$92/unit
Limited justification
10,000 units
$18.40/unit
Moderate opportunity
50,000 units
$3.68/unit
Strong ROI
100,000 units
$1.84/unit
Maximum leverage
Custom saddle development becomes increasingly attractive when annual volume exceeds approximately 10,000 units or when the product carries premium market positioning.