OEM and ODM bicycle saddles plus global bicycle components sourcing
OEM and ODM bicycle saddles plus global bicycle components sourcing
How Much Does a Bike Saddle Cost? Complete OEM Manufacturing Cost Breakdown, TCO Analysis and Supplier ROI Model
—— Engineering Cost Structure, Material Selection Trade-Offs and Lifecycle Economics for Bicycle Brands
Key Decision Metrics
Under the stated OEM manufacturing assumptions, a saddle platform redesign requires estimated engineering and tooling CapEx of $35 000–45 000, including mold modification, prototype iteration and validation testing. The modeled payback period is approximately 14–20 months at 50 000 units/year production volume, while lifecycle TCO improvement is estimated at 8–15% depending on baseline warranty rate, supplier yield and tooling utilization. ISO 4210-9 validation should target a fatigue margin above minimum compliance requirements because production variation, environmental aging and user loading differences can reduce practical safety factors. The recommended minimum commercial volume for advanced saddle redesign is approximately 20 000–50 000 units/year, below which tooling depreciation becomes the dominant economic constraint.
A bicycle saddle quotation normally reflects only the visible manufacturing transaction between buyer and supplier. However, OEM purchasing decisions are affected by four interconnected cost categories: Acquisition and tooling CapEx. Direct manufacturing and unit operating cost. Field reliability and warranty exposure. Supply-chain risk and inventory requirements. A complete lifecycle model can be expressed as: The following analysis uses industrial planning assumptions rather than confidential supplier quotations. Bicycle component manufacturers rarely publish audited cost structures; therefore, the figures should be treated as a decision model that can be replaced with internal purchasing data.
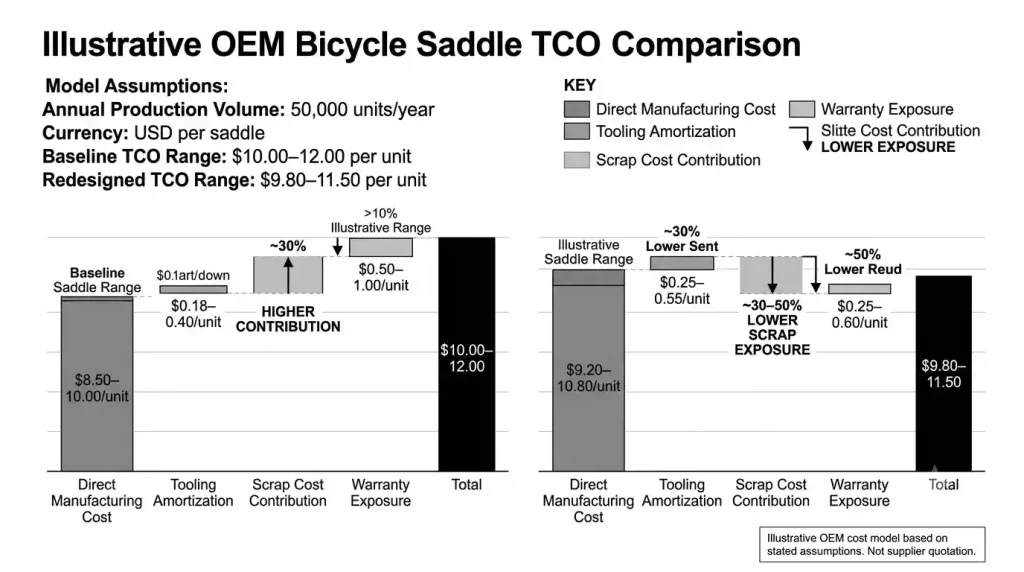
Table Insights: The redesigned saddle does not necessarily achieve a lower factory quotation. The economic benefit comes from reducing hidden costs after production, especially warranty exposure, scrap losses and quality-related disruptions.
A common procurement mistake is selecting the lowest FOB supplier without analyzing downstream costs. A supplier reducing saddle price by $0.40/unit may achieve short-term purchasing savings while increasing replacement events through lower foam durability, weaker bonding processes or inconsistent rail alignment.
For a bicycle brand shipping 100 000 saddles annually, even a small reliability difference can materially affect operating cost. A 0.5% avoidable return difference represents approximately 500 additional replacement cases. When logistics, retailer handling and customer-service costs are included, the effective cost can exceed the original unit-price saving.
The commercial decision is therefore not “Which supplier quotes the cheapest saddle?” but “Which supplier creates the lowest lifecycle cost?”
🖼️ [Visual Suggestion / Technical Diagram]: Create a TCO waterfall chart comparing baseline saddle and redesigned saddle. Show five cost layers: tooling amortization, material cost, assembly, scrap loss and warranty exposure. The executive focus point should be the reduction of post-production cost rather than FOB price difference.
2. Material Engineering Economics: Foam, Rails and Shell Design
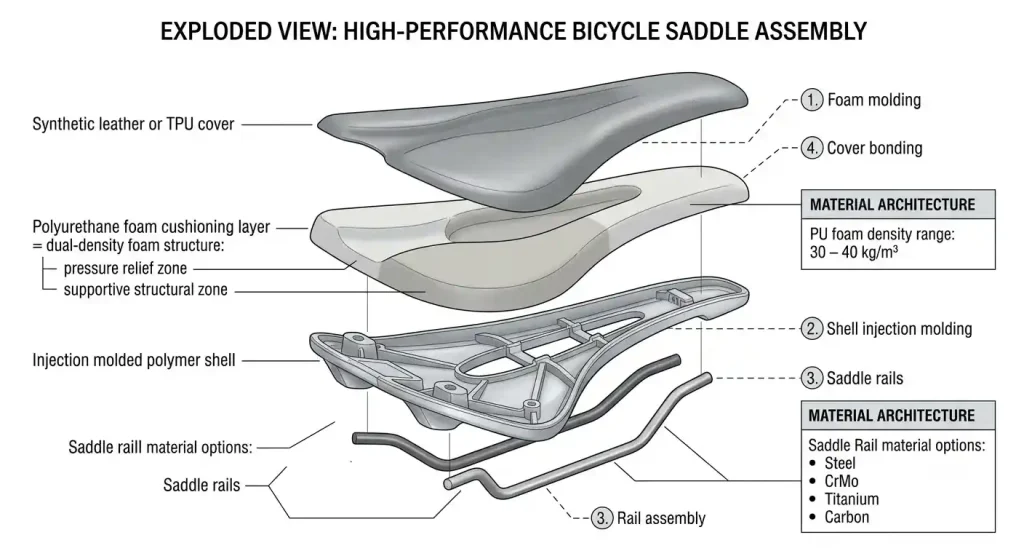
A bicycle saddle is a multi-material structure where every component affects both engineering performance and financial outcome. The main structural layers include: The rail system transferring rider loads. The polymer shell distributing mechanical stress. The foam layer controlling pressure distribution. The cover system protecting the assembly. Material selection should therefore be based on lifecycle economics rather than specification competition.
PU Foam Density and Compression Performance
Polyurethane foam remains one of the most common cushioning materials in bicycle saddle production. Typical saddle applications use foam densities approximately within the 30–40 kg m⁻³ range. Lower-density foam reduces material consumption and unit weight, but excessive reduction can increase permanent deformation and reduce long-term comfort retention. Higher-density foam improves durability but increases material cost and may create a firmer riding sensation. The engineering challenge is controlling:
compression resistance;
rebound behavior;
long-term deformation;
rider pressure distribution. Dual-density foam structures can improve performance by placing different stiffness zones according to rider loading patterns. However, the additional process complexity must justify the cost increase.
Rail Material Trade-Off
Rail selection is one of the clearest examples of engineering versus economics. Standard steel rails remain widely used because of mature manufacturing capability and low cost. CrMo rails provide improved strength-to-weight performance with moderate cost increase. Titanium rails reduce weight and provide corrosion resistance but require specialized processing. Carbon rails provide maximum weight reduction but introduce higher manufacturing sensitivity because fiber orientation, bonding quality and curing parameters directly affect fatigue performance. For high-volume OEM products, CrMo optimization often provides stronger ROI than carbon adoption because it improves performance without creating excessive process risk.
A lighter saddle does not automatically generate higher profit if manufacturing yield decreases.
3. Tooling CapEx and Production Volume Economics
Tooling investment is one of the largest fixed costs in saddle development. Mold selection directly affects:
surface quality;
maintenance requirements;
production stability;
lifetime manufacturing cost.
P20 tool steel is commonly selected for general injection molding because of machining efficiency and acceptable durability.
S136 stainless mold steel provides improved corrosion resistance and polishing capability, making it attractive for higher-volume production or appearance-critical applications.
The correct choice depends on production volume rather than material preference.
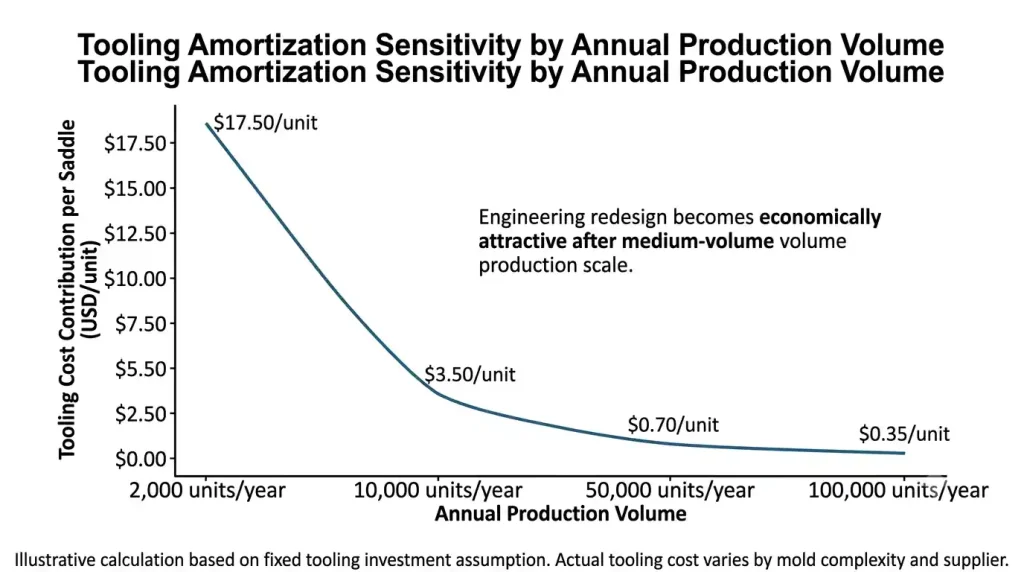
A $35 000 mold investment distributed across 200 000 units contributes approximately $0.175/unit. The same tooling cost distributed across 20 000 units contributes $1.75/unit.
Volume determines whether engineering investment creates value.Annual VolumeTooling ScenarioCost AssumptionPayback EvaluationProcurement Decision2 000 units/year$35 000 tooling investmentChina OEM production assumption>36 monthsAvoid major redesign10 000 units/yearSame tooling investmentSame manufacturing basis28–36 monthsImprove existing product50 000 units/yearSame tooling investmentMedium-volume OEM program14–20 monthsRecommended redesign point100 000 units/yearSame tooling investmentHigh-volume platform<12 monthsFull optimization justifiedTable Insights: Tooling investment becomes financially attractive only after sufficient production volume is achieved. Below approximately 20 000 units/year, purchasing teams should prioritize process improvement before expensive structural redesign.🖼️ [Visual Suggestion / Technical Diagram]: Create a break-even curve showing tooling cost per unit versus annual volume from 2 000 to 100 000 units. The executive focus point should be the volume threshold where fixed engineering cost becomes economically insignificant.4. ISO 4210-9 Reliability and Warranty Risk ReductionSaddle failures are usually fatigue-driven rather than caused by single overload events. During riding, the saddle experiences repeated:
vertical compression;rearward shear;vibration loading;local stress concentration. ISO 4210-9 fatigue testing evaluates saddle durability under repeated dynamic loading conditions. Depending on configuration, testing commonly involves loads around 1 000–1 200 N and cycle counts typically within the 100 000–200 000 range. Passing the test represents minimum compliance. For commercial reliability, manufacturers should target additional fatigue margin. Stress concentration is particularly important around rail-shell interfaces. Small geometric changes around rail attachment points can significantly influence fatigue life. Common failure modes include:shell cracking around rail mounts;rail bending fatigue;foam permanent deformation;cover delamination;adhesive interface failure. These failures create different cost consequences. Structural failure usually generates warranty replacement. Comfort degradation creates customer dissatisfaction and retailer returns. Both affect lifecycle economics. 📌 “ISO 4210-9 compliance defines the minimum acceptance threshold, but additional fatigue margin determines whether a saddle remains economically reliable after mass production variation and real-world usage.” Published bicycle pressure-mapping studies commonly report saddle contact pressures approximately within the 30–66 kPa range depending on rider position, saddle geometry and measurement method. Because testing methods vary, manufacturers should rely on comparative internal evaluation rather than universal pressure claims.
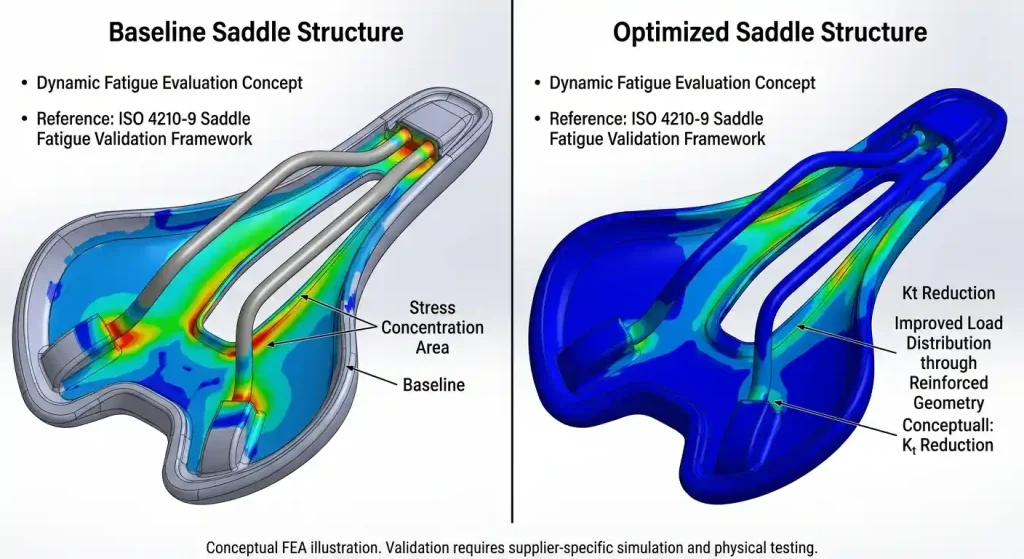
The commercial objective is reducing both mechanical failures and comfort-related returns.5. ROI Modeling and Engineering Investment DecisionsA saddle redesign should be approved through financial evaluation rather than technical preference. The investment model should include: A representative scenario: Engineering investment: $35 000 Annual production: 50 000 units Expected annual savings: $20 000–30 000 Estimated payback: 14–20 months Actual results depend on supplier yield, existing failure rate and product positioning.Engineering UpgradeBaselineRedesigned PlatformUnit Cost ImpactBusiness EffectRail SystemStandard steelOptimized CrMo+$0.30–0.80/unitBetter fatigue performanceFoam StructureSingle density PUDual-density foam+$0.20–0.50/unitReduced comfort returnsShell DesignConventional shellReinforced stress zones+$0.10–0.30/unitLower fatigue riskValidationMinimum testingExtended fatigue evaluation+$0.05–0.15/unit amortizedLower warranty uncertaintyTable Insights: The highest ROI improvement is usually not the most expensive material. Engineering changes that reduce failure probability while maintaining production simplicity create the strongest financial return.🖼️ [Visual Suggestion / Technical Diagram]: Create an FEA stress comparison image of rail-shell interface before and after redesign. Highlight stress concentration reduction rather than weight reduction.6. Strategic Procurement Framework: Selecting the Right Saddle SupplierOEM buyers should evaluate suppliers based on engineering capability rather than quotation price alone. A qualified saddle supplier should demonstrate:
material traceability;tooling capability;fatigue validation records;production quality control;engineering response speed.
China, Vietnam and Taiwan Supply Chain ConsiderationsFactorChinaVietnamTaiwanMaterial EcosystemStrong rail, foam and mold supply chainDevelopingStrong bicycle component expertiseTooling CapabilityAdvanced CNC and mold engineeringGrowingHigh precisionEngineering SupportStrong OEM development capabilitySupplier dependentStrong technical cultureCost AdvantageBalancedLabor advantagePremium positioningTable Insights: Manufacturing location should be selected according to product complexity. Lower labor cost does not automatically produce lower lifecycle cost if engineering capability and supplier control are limited.A reliable sourcing strategy often combines:China for complex engineering integration and volume production.Vietnam for selected supply diversification.Taiwan for premium component expertise.B2B Action Block: Bicycle Saddle Cost Evaluation ResourcesFor bicycle brands evaluating OEM saddle development, the following tools should be prepared: Interactive TCO/ROI Calculation Spreadsheet Including:
tooling amortization;
material selection scenarios;
production volume sensitivity;
warranty exposure;
supplier comparison. ISO 4210 Saddle Validation Checklist PDF Including:
fatigue testing review;
rail inspection;
shell evaluation;
material traceability;
production acceptance criteria. Expert Sample Evaluation Channel Including:
prototype review;
material comparison;
pressure distribution assessment;
supplier qualification support. The correct question is not: “How much does a bike saddle cost?” The correct question is: “What total economic value does each saddle create throughout its lifecycle?”